DET 曲線#
- sklearn.metrics.det_curve(y_true, y_score, pos_label=None, sample_weight=None)[原始碼]#
計算不同機率閾值的錯誤率。
注意
此指標用於評估二元分類任務的排名和錯誤權衡。
請在使用者指南中閱讀更多內容。
於 0.24 版新增。
- 參數:
- y_true形狀為 (n_samples,) 的 ndarray
真實二元標籤。如果標籤不是 {-1, 1} 或 {0, 1},則應明確給定 pos_label。
- y_score形狀為 (n_samples,) 的 ndarray
目標分數,可以是正類別的機率估計值、信賴度值或未閾值化的決策量度(由某些分類器上的「decision_function」傳回)。
- pos_labelint、float、bool 或 str,預設值為 None
正類別的標籤。當
pos_label=None時,如果y_true在 {-1, 1} 或 {0, 1} 中,則pos_label設定為 1,否則會引發錯誤。- sample_weight形狀為 (n_samples,) 的類陣列,預設值為 None
樣本權重。
- 傳回:
- fpr形狀為 (n_thresholds,) 的 ndarray
偽陽性率 (FPR),使得元素 i 為分數 >= thresholds[i] 的預測的偽陽性率。這偶爾會被稱為錯誤接受機率或失效。
- fnr形狀為 (n_thresholds,) 的 ndarray
偽陰性率 (FNR),使得元素 i 為分數 >= thresholds[i] 的預測的偽陰性率。這偶爾會被稱為錯誤拒絕或錯失率。
- thresholds形狀為 (n_thresholds,) 的 ndarray
遞減分數值。
另請參閱
DetCurveDisplay.from_estimator繪製給定估計器和某些資料的 DET 曲線。
DetCurveDisplay.from_predictions繪製給定真實標籤和預測標籤的 DET 曲線。
DetCurveDisplayDET 曲線視覺化。
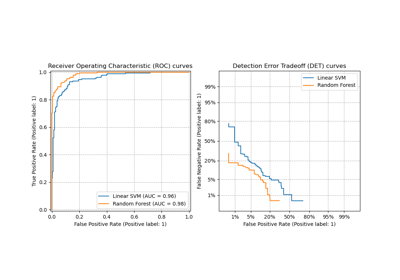
roc_curve計算接收者操作特徵 (ROC) 曲線。
precision_recall_curve計算精確度-召回率曲線。
範例
>>> import numpy as np
>>> from sklearn.metrics import det_curve
>>> y_true = np.array([0, 0, 1, 1])
>>> y_scores = np.array([0.1, 0.4, 0.35, 0.8])
>>> fpr, fnr, thresholds = det_curve(y_true, y_scores)
>>> fpr
array([0.5, 0.5, 0. ])
>>> fnr
array([0. , 0.5, 0.5])
>>> thresholds
array([0.35, 0.4 , 0.8 ])