PrecisionRecallDisplay#
- class sklearn.metrics.PrecisionRecallDisplay(precision, recall, *, average_precision=None, estimator_name=None, pos_label=None, prevalence_pos_label=None)[原始碼]#
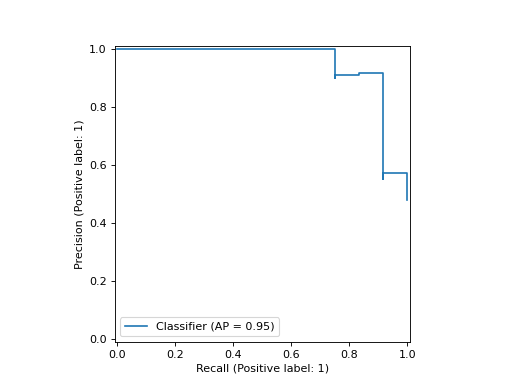
精確度-召回率視覺化。
建議使用
from_estimator或from_predictions來建立PrecisionRecallDisplay。所有參數都會儲存為屬性。更多資訊請參閱 使用者指南。
- 參數:
- precisionndarray
精確度數值。
- recallndarray
召回率數值。
- average_precisionfloat,預設為 None
平均精確度。如果為 None,則不顯示平均精確度。
- estimator_namestr,預設為 None
估計器的名稱。如果為 None,則不顯示估計器名稱。
- pos_labelint、float、bool 或 str,預設為 None
被視為正類別的類別。如果為 None,則圖例中不會顯示該類別。
在 0.24 版本中新增。
- prevalence_pos_labelfloat,預設為 None
正類別的盛行率。它用於繪製機會水平線。如果為 None,即使在繪圖時將
plot_chance_level設為 True,也不會繪製機會水平線。在 1.3 版本中新增。
- 屬性:
- line_matplotlib Artist
精確度-召回率曲線。
- chance_level_matplotlib Artist 或 None
機會水平線。如果未繪製機會水平線,則為
None。在 1.3 版本中新增。
- ax_matplotlib Axes
具有精確度-召回率曲線的軸。
- figure_matplotlib Figure
包含曲線的圖形。
參見
precision_recall_curve計算不同機率閾值的精確度-召回率對。
PrecisionRecallDisplay.from_estimator繪製給定二元分類器的精確度-召回率曲線。
PrecisionRecallDisplay.from_predictions使用二元分類器的預測繪製精確度-召回率曲線。
註解
scikit-learn 中的平均精確度(參見
average_precision_score)的計算不含任何內插。為了與此指標一致,精確度-召回率曲線的繪製也不含任何內插(階梯式樣式)。您可以透過在
plot、from_estimator或from_predictions中傳遞關鍵字引數drawstyle="default"來變更此樣式。但是,曲線將不會與回報的平均精確度完全一致。範例
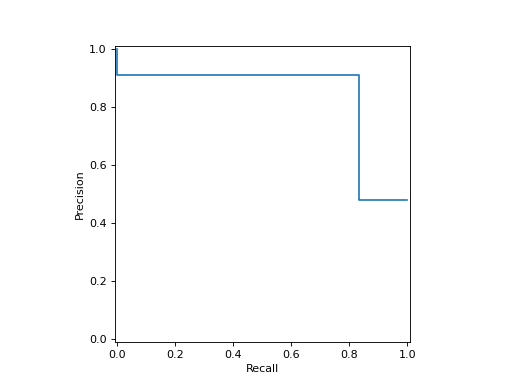
>>> import matplotlib.pyplot as plt
>>> from sklearn.datasets import make_classification
>>> from sklearn.metrics import (precision_recall_curve,
...                              PrecisionRecallDisplay)
>>> from sklearn.model_selection import train_test_split
>>> from sklearn.svm import SVC
>>> X, y = make_classification(random_state=0)
>>> X_train, X_test, y_train, y_test = train_test_split(X, y,
...                                                     random_state=0)
>>> clf = SVC(random_state=0)
>>> clf.fit(X_train, y_train)
SVC(random_state=0)
>>> predictions = clf.predict(X_test)
>>> precision, recall, _ = precision_recall_curve(y_test, predictions)
>>> disp = PrecisionRecallDisplay(precision=precision, recall=recall)
>>> disp.plot()
<...>
>>> plt.show()
- classmethod from_estimator(estimator, X, y, *, sample_weight=None, pos_label=None, drop_intermediate=False, response_method='auto', name=None, ax=None, plot_chance_level=False, chance_level_kw=None, despine=False, **kwargs)[原始碼]#
繪製給定估計器和一些資料的精確度-召回率曲線。
- 參數:
- estimator估計器實例
已擬合的分類器或已擬合的
Pipeline,其中最後一個估計器是分類器。- X{array-like、稀疏矩陣},形狀為 (n_samples, n_features)
輸入值。
- yarray-like,形狀為 (n_samples,)
目標值。
- sample_weightarray-like,形狀為 (n_samples,),預設為 None
樣本權重。
- pos_labelint、float、bool 或 str,預設為 None
當計算精確度和召回率指標時,被視為正類別的類別。預設情況下,
estimators.classes_[1]會被視為正類別。- drop_intermediatebool,預設為 False
是否捨棄一些次佳的閾值,這些閾值不會出現在繪製的精確度-召回率曲線上。這對於建立較輕量的精確度-召回率曲線很有用。
在 1.3 版本中新增。
- response_method{‘predict_proba’、‘decision_function’、‘auto’},預設為 ‘auto’
指定要使用 predict_proba 或 decision_function 作為目標響應。如果設定為 ‘auto’,則會先嘗試 predict_proba,如果它不存在,則會嘗試 decision_function。
- namestr,預設為 None
用於標記曲線的名稱。如果為
None,則不會使用任何名稱。- axmatplotlib 軸,預設為 None
要繪製的軸物件。如果為
None,則會建立新的圖表和軸。- plot_chance_levelbool,預設值為 False
是否繪製機會水平線。機會水平線是根據在呼叫
from_estimator或from_predictions時傳入的數據所計算出的正標籤的普及率。在 1.3 版本中新增。
- chance_level_kwdict,預設值為 None
要傳遞給 matplotlib 的
plot以渲染機會水平線的關鍵字參數。在 1.3 版本中新增。
- despinebool,預設值為 False
是否從圖表中移除頂部和右側的邊框。
1.6 版本新增。
- **kwargsdict
要傳遞給 matplotlib 的
plot的關鍵字參數。
- 回傳值:
- display
PrecisionRecallDisplay
- display
參見
PrecisionRecallDisplay.from_predictions使用估計的機率或決策函數的輸出繪製精確度-召回率曲線。
註解
scikit-learn 中的平均精確度(參見
average_precision_score)的計算不含任何內插。為了與此指標一致,精確度-召回率曲線的繪製也不含任何內插(階梯式樣式)。您可以通過傳遞關鍵字參數
drawstyle="default"來更改此樣式。但是,曲線不會與報告的平均精確度完全一致。範例
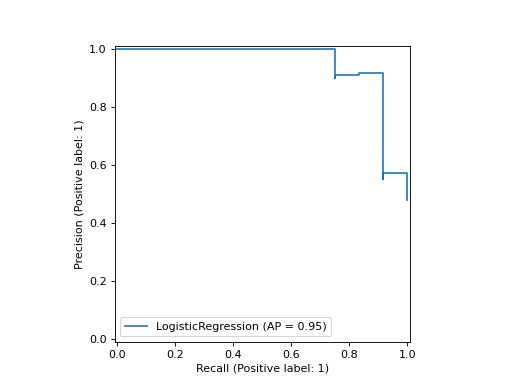
>>> import matplotlib.pyplot as plt
>>> from sklearn.datasets import make_classification
>>> from sklearn.metrics import PrecisionRecallDisplay
>>> from sklearn.model_selection import train_test_split
>>> from sklearn.linear_model import LogisticRegression
>>> X, y = make_classification(random_state=0)
>>> X_train, X_test, y_train, y_test = train_test_split(
...         X, y, random_state=0)
>>> clf = LogisticRegression()
>>> clf.fit(X_train, y_train)
LogisticRegression()
>>> PrecisionRecallDisplay.from_estimator(
...    clf, X_test, y_test)
<...>
>>> plt.show()
- classmethod from_predictions(y_true, y_pred, *, sample_weight=None, pos_label=None, drop_intermediate=False, name=None, ax=None, plot_chance_level=False, chance_level_kw=None, despine=False, **kwargs)[原始碼]#
根據二元類別預測繪製精確度-召回率曲線。
- 參數:
- y_true形狀為 (n_samples,) 的類陣列
真實的二元標籤。
- y_pred形狀為 (n_samples,) 的類陣列
估計的機率或決策函數的輸出。
- sample_weightarray-like,形狀為 (n_samples,),預設為 None
樣本權重。
- pos_labelint、float、bool 或 str,預設為 None
計算精確度和召回率指標時,將被視為正類別的類別。
- drop_intermediatebool,預設為 False
是否捨棄一些次佳的閾值,這些閾值不會出現在繪製的精確度-召回率曲線上。這對於建立較輕量的精確度-召回率曲線很有用。
在 1.3 版本中新增。
- namestr,預設為 None
用於標記曲線的名稱。如果為
None,則名稱將設定為"分類器"。- axmatplotlib 軸,預設為 None
要繪製的軸物件。如果為
None,則會建立新的圖表和軸。- plot_chance_levelbool,預設值為 False
是否繪製機會水平線。機會水平線是根據在呼叫
from_estimator或from_predictions時傳入的數據所計算出的正標籤的普及率。在 1.3 版本中新增。
- chance_level_kwdict,預設值為 None
要傳遞給 matplotlib 的
plot以渲染機會水平線的關鍵字參數。在 1.3 版本中新增。
- despinebool,預設值為 False
是否從圖表中移除頂部和右側的邊框。
1.6 版本新增。
- **kwargsdict
要傳遞給 matplotlib 的
plot的關鍵字參數。
- 回傳值:
- display
PrecisionRecallDisplay
- display
參見
PrecisionRecallDisplay.from_estimator使用估計器繪製精確度-召回率曲線。
註解
scikit-learn 中的平均精確度(參見
average_precision_score)的計算不含任何內插。為了與此指標一致,精確度-召回率曲線的繪製也不含任何內插(階梯式樣式)。您可以通過傳遞關鍵字參數
drawstyle="default"來更改此樣式。但是,曲線不會與報告的平均精確度完全一致。範例
>>> import matplotlib.pyplot as plt
>>> from sklearn.datasets import make_classification
>>> from sklearn.metrics import PrecisionRecallDisplay
>>> from sklearn.model_selection import train_test_split
>>> from sklearn.linear_model import LogisticRegression
>>> X, y = make_classification(random_state=0)
>>> X_train, X_test, y_train, y_test = train_test_split(
...         X, y, random_state=0)
>>> clf = LogisticRegression()
>>> clf.fit(X_train, y_train)
LogisticRegression()
>>> y_pred = clf.predict_proba(X_test)[:, 1]
>>> PrecisionRecallDisplay.from_predictions(
...    y_test, y_pred)
<...>
>>> plt.show()
- plot(ax=None, *, name=None, plot_chance_level=False, chance_level_kw=None, despine=False, **kwargs)[原始碼]#
繪製視覺化圖表。
額外的關鍵字參數將傳遞給 matplotlib 的
plot。- 參數:
- axMatplotlib 軸,預設值為 None
要繪製的軸物件。如果為
None,則會建立新的圖表和軸。- namestr,預設為 None
用於標記的精確度召回率曲線名稱。如果為
None,則如果estimator_name不是None,則使用estimator_name,否則不顯示標記。- plot_chance_levelbool,預設值為 False
是否繪製機會水平線。機會水平線是根據在呼叫
from_estimator或from_predictions時傳入的數據所計算出的正標籤的普及率。在 1.3 版本中新增。
- chance_level_kwdict,預設值為 None
要傳遞給 matplotlib 的
plot以渲染機會水平線的關鍵字參數。在 1.3 版本中新增。
- despinebool,預設值為 False
是否從圖表中移除頂部和右側的邊框。
1.6 版本新增。
- **kwargsdict
要傳遞給 matplotlib 的
plot的關鍵字參數。
- 回傳值:
- display
PrecisionRecallDisplay 儲存計算值的物件。
- display
註解
scikit-learn 中的平均精確度(參見
average_precision_score)的計算不含任何內插。為了與此指標一致,精確度-召回率曲線的繪製也不含任何內插(階梯式樣式)。您可以通過傳遞關鍵字參數
drawstyle="default"來更改此樣式。但是,曲線不會與報告的平均精確度完全一致。