注意
跳到結尾下載完整的範例程式碼,或透過 JupyterLite 或 Binder 在您的瀏覽器中執行此範例
譜共分群演算法的示範#
此範例示範如何產生資料集並使用譜共分群演算法對其進行雙分群。
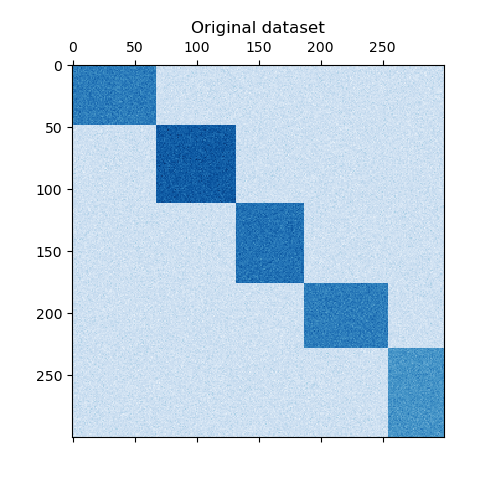
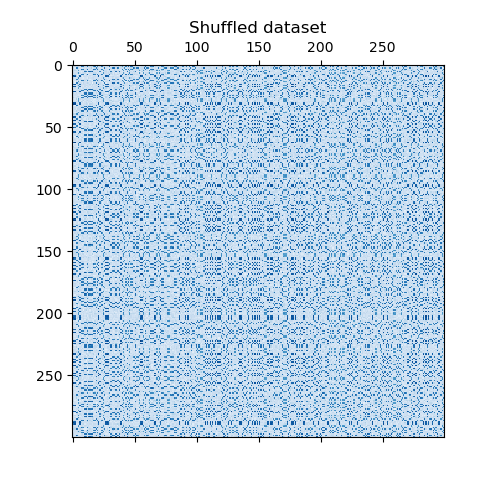
資料集是使用 make_biclusters 函數產生,該函數會建立一個小值的矩陣,並植入具有大值的雙分群。然後將行和列隨機排序,並傳遞給譜共分群演算法。重新排列隨機排序的矩陣以使雙分群連續,顯示演算法如何準確地找到雙分群。
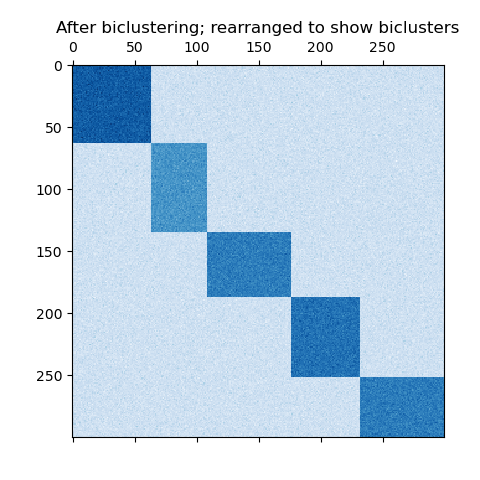
consensus score: 1.000
# Authors: The scikit-learn developers
# SPDX-License-Identifier: BSD-3-Clause
import numpy as np
from matplotlib import pyplot as plt
from sklearn.cluster import SpectralCoclustering
from sklearn.datasets import make_biclusters
from sklearn.metrics import consensus_score
data, rows, columns = make_biclusters(
shape=(300, 300), n_clusters=5, noise=5, shuffle=False, random_state=0
)
plt.matshow(data, cmap=plt.cm.Blues)
plt.title("Original dataset")
# shuffle clusters
rng = np.random.RandomState(0)
row_idx = rng.permutation(data.shape[0])
col_idx = rng.permutation(data.shape[1])
data = data[row_idx][:, col_idx]
plt.matshow(data, cmap=plt.cm.Blues)
plt.title("Shuffled dataset")
model = SpectralCoclustering(n_clusters=5, random_state=0)
model.fit(data)
score = consensus_score(model.biclusters_, (rows[:, row_idx], columns[:, col_idx]))
print("consensus score: {:.3f}".format(score))
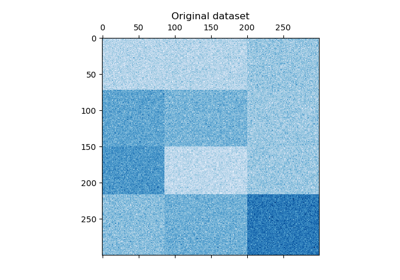
fit_data = data[np.argsort(model.row_labels_)]
fit_data = fit_data[:, np.argsort(model.column_labels_)]
plt.matshow(fit_data, cmap=plt.cm.Blues)
plt.title("After biclustering; rearranged to show biclusters")
plt.show()
腳本的總執行時間: (0 分鐘 0.374 秒)
相關範例