注意
前往結尾 以下載完整的範例程式碼。或透過 JupyterLite 或 Binder 在您的瀏覽器中執行此範例
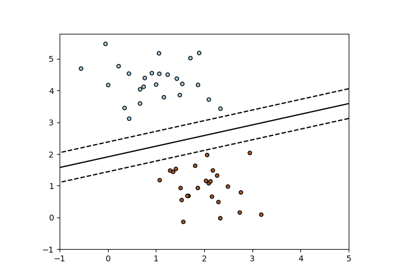
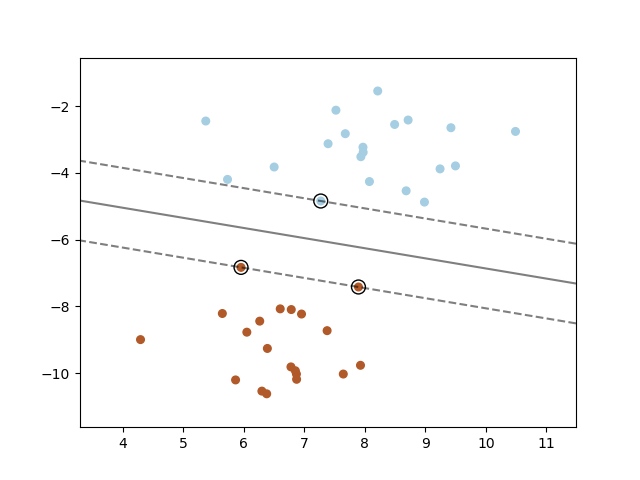
SVM:最大邊距分離超平面#
使用具有線性核函數的支持向量機分類器,繪製兩類可分離資料集中的最大邊距分離超平面。
# Authors: The scikit-learn developers
# SPDX-License-Identifier: BSD-3-Clause

import matplotlib.pyplot as plt

from sklearn import svm
from sklearn.datasets import make_blobs
from sklearn.inspection import DecisionBoundaryDisplay

# we create 40 separable points
X, y = make_blobs(n_samples=40, centers=2, random_state=6)

# fit the model, don't regularize for illustration purposes
clf = svm.SVC(kernel="linear", C=1000)
clf.fit(X, y)

plt.scatter(X[:, 0], X[:, 1], c=y, s=30, cmap=plt.cm.Paired)

# plot the decision function
ax = plt.gca()
DecisionBoundaryDisplay.from_estimator(
    clf,
    X,
    plot_method="contour",
    colors="k",
    levels=[-1, 0, 1],
    alpha=0.5,
    linestyles=["--", "-", "--"],
    ax=ax,
)
# plot support vectors
ax.scatter(
    clf.support_vectors_[:, 0],
    clf.support_vectors_[:, 1],
    s=100,
    linewidth=1,
    facecolors="none",
    edgecolors="k",
)
plt.show()
腳本的總運行時間: (0 分鐘 0.071 秒)
相關範例