注意
前往結尾下載完整範例程式碼。或透過 JupyterLite 或 Binder 在您的瀏覽器中執行此範例
標籤傳播數字:示範效能#
此範例示範了半監督學習的能力,透過訓練標籤擴散模型,使用少量標籤組來分類手寫數字。
手寫數字資料集總共有 1797 個點。該模型將使用所有點進行訓練,但只有 30 個點將被標記。結果以混淆矩陣和每個類別的一系列指標的形式呈現,將會非常好。
最後,將顯示前 10 個最不確定的預測。
# Authors: The scikit-learn developers
# SPDX-License-Identifier: BSD-3-Clause
資料產生#
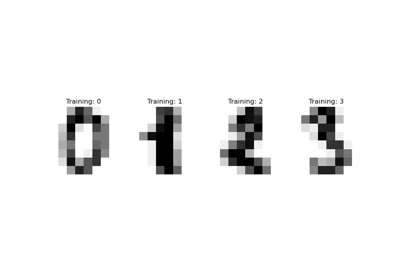
我們使用數字資料集。我們只使用隨機選擇的樣本子集。
import numpy as np

from sklearn import datasets

digits = datasets.load_digits()
rng = np.random.RandomState(2)
indices = np.arange(len(digits.data))
rng.shuffle(indices)
我們選擇了 340 個樣本,其中只有 40 個樣本會與已知的標籤相關聯。因此,我們儲存了其他 300 個樣本的索引,我們不應該知道它們的標籤。
X = digits.data[indices[:340]]
y = digits.target[indices[:340]]
images = digits.images[indices[:340]]

n_total_samples = len(y)
n_labeled_points = 40

indices = np.arange(n_total_samples)

unlabeled_set = indices[n_labeled_points:]
將所有內容隨機排列
y_train = np.copy(y)
y_train[unlabeled_set] = -1
半監督學習#
我們擬合一個LabelSpreading並使用它來預測未知的標籤。
from sklearn.metrics import classification_report
from sklearn.semi_supervised import LabelSpreading

lp_model = LabelSpreading(gamma=0.25, max_iter=20)
lp_model.fit(X, y_train)
predicted_labels = lp_model.transduction_[unlabeled_set]
true_labels = y[unlabeled_set]

print(
    "Label Spreading model: %d labeled & %d unlabeled points (%d total)"
    % (n_labeled_points, n_total_samples - n_labeled_points, n_total_samples)
)
Label Spreading model: 40 labeled & 300 unlabeled points (340 total)
分類報告
print(classification_report(true_labels, predicted_labels))
              precision    recall  f1-score   support

           0       1.00      1.00      1.00        27
           1       0.82      1.00      0.90        37
           2       1.00      0.86      0.92        28
           3       1.00      0.80      0.89        35
           4       0.92      1.00      0.96        24
           5       0.74      0.94      0.83        34
           6       0.89      0.96      0.92        25
           7       0.94      0.89      0.91        35
           8       1.00      0.68      0.81        31
           9       0.81      0.88      0.84        24

    accuracy                           0.90       300
   macro avg       0.91      0.90      0.90       300
weighted avg       0.91      0.90      0.90       300
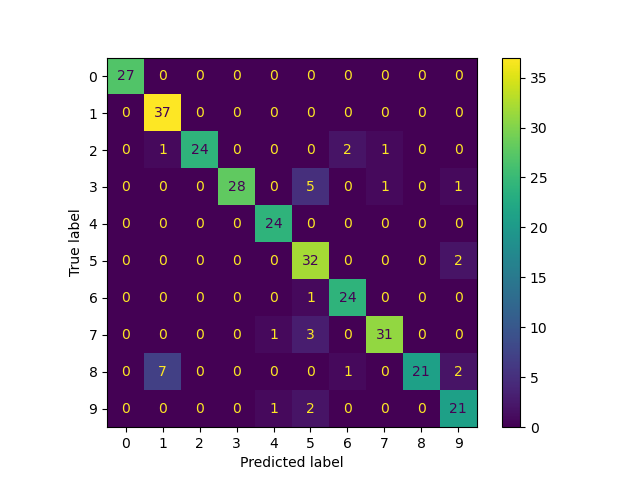
混淆矩陣
from sklearn.metrics import ConfusionMatrixDisplay

ConfusionMatrixDisplay.from_predictions(
    true_labels, predicted_labels, labels=lp_model.classes_
)
<sklearn.metrics._plot.confusion_matrix.ConfusionMatrixDisplay object at 0x74b4a9371940>
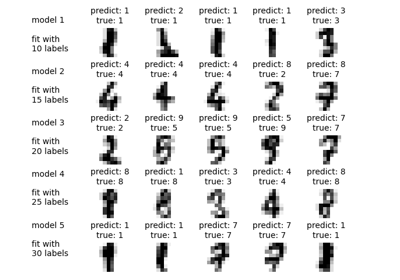
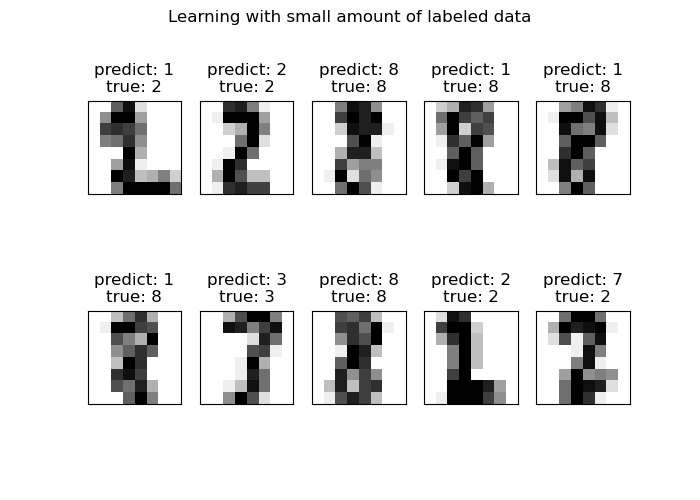
繪製最不確定的預測#
在這裡,我們將挑選並顯示 10 個最不確定的預測。
from scipy import stats

pred_entropies = stats.distributions.entropy(lp_model.label_distributions_.T)
挑選前 10 個最不確定的標籤
uncertainty_index = np.argsort(pred_entropies)[-10:]
繪圖
import matplotlib.pyplot as plt

f = plt.figure(figsize=(7, 5))
for index, image_index in enumerate(uncertainty_index):
    image = images[image_index]

    sub = f.add_subplot(2, 5, index + 1)
    sub.imshow(image, cmap=plt.cm.gray_r)
    plt.xticks([])
    plt.yticks([])
    sub.set_title(
        "predict: %i\ntrue: %i" % (lp_model.transduction_[image_index], y[image_index])
    )

f.suptitle("Learning with small amount of labeled data")
plt.show()
腳本的總執行時間:(0 分鐘 0.401 秒)
相關範例