注意
前往結尾以下載完整的範例程式碼。或透過 JupyterLite 或 Binder 在您的瀏覽器中執行此範例
SVM-Anova:具有單變量特徵選擇的 SVM#
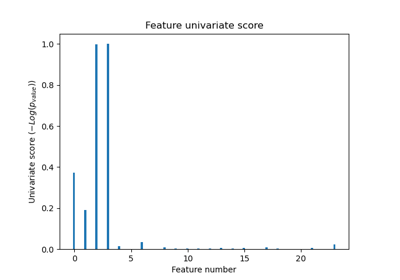
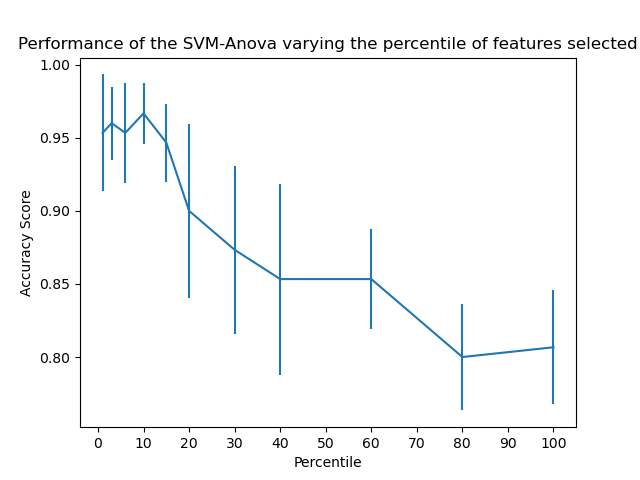
此範例顯示如何在執行 SVC(支援向量分類器)之前執行單變量特徵選擇,以提高分類分數。 我們使用 iris 資料集(4 個特徵)並新增 36 個無資訊特徵。 我們可以發現,當我們選擇約 10% 的特徵時,我們的模型可達到最佳效能。
# Authors: The scikit-learn developers
# SPDX-License-Identifier: BSD-3-Clause
載入一些資料進行嘗試#
import numpy as np

from sklearn.datasets import load_iris

X, y = load_iris(return_X_y=True)

# Add non-informative features
rng = np.random.RandomState(0)
X = np.hstack((X, 2 * rng.random((X.shape[0], 36))))
建立管道#
from sklearn.feature_selection import SelectPercentile, f_classif
from sklearn.pipeline import Pipeline
from sklearn.preprocessing import StandardScaler
from sklearn.svm import SVC

# Create a feature-selection transform, a scaler and an instance of SVM that we
# combine together to have a full-blown estimator

clf = Pipeline(
    [
        ("anova", SelectPercentile(f_classif)),
        ("scaler", StandardScaler()),
        ("svc", SVC(gamma="auto")),
    ]
)
繪製交叉驗證分數作為特徵百分位數的函數#
import matplotlib.pyplot as plt

from sklearn.model_selection import cross_val_score

score_means = list()
score_stds = list()
percentiles = (1, 3, 6, 10, 15, 20, 30, 40, 60, 80, 100)

for percentile in percentiles:
    clf.set_params(anova__percentile=percentile)
    this_scores = cross_val_score(clf, X, y)
    score_means.append(this_scores.mean())
    score_stds.append(this_scores.std())

plt.errorbar(percentiles, score_means, np.array(score_stds))
plt.title("Performance of the SVM-Anova varying the percentile of features selected")
plt.xticks(np.linspace(0, 100, 11, endpoint=True))
plt.xlabel("Percentile")
plt.ylabel("Accuracy Score")
plt.axis("tight")
plt.show()
腳本的總執行時間: (0 分鐘 0.388 秒)
相關範例