註記
前往結尾以下載完整的範例程式碼。或透過 JupyterLite 或 Binder 在您的瀏覽器中執行此範例
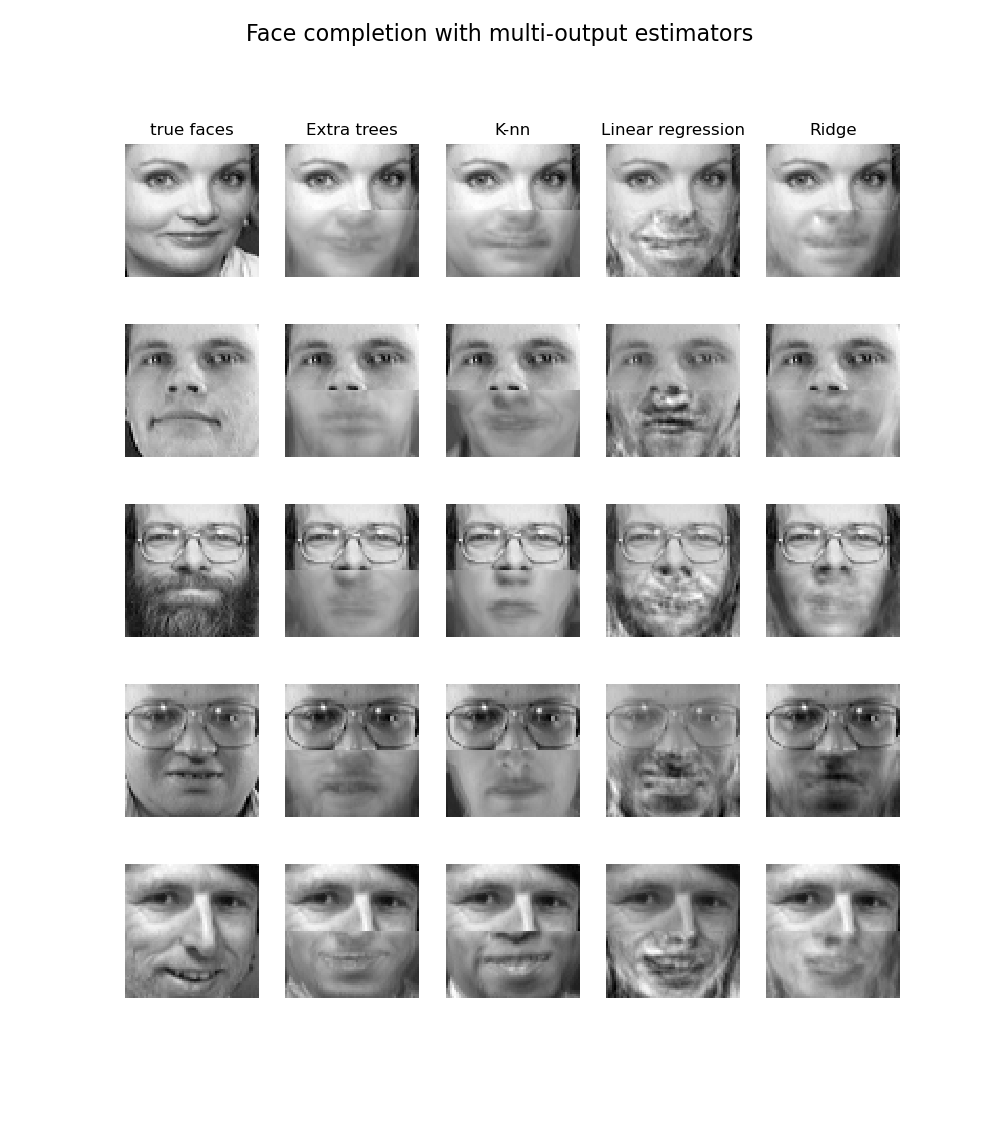
使用多輸出估計器完成臉部#
此範例顯示如何使用多輸出估計器來完成圖像。 目標是根據臉部的上半部分預測其下半部分。
第一欄圖像顯示真實的臉部。 下一欄顯示極度隨機樹、k 最近鄰居、線性迴歸和嶺迴歸如何完成這些臉部的下半部分。
# Authors: The scikit-learn developers
# SPDX-License-Identifier: BSD-3-Clause

import matplotlib.pyplot as plt
import numpy as np

from sklearn.datasets import fetch_olivetti_faces
from sklearn.ensemble import ExtraTreesRegressor
from sklearn.linear_model import LinearRegression, RidgeCV
from sklearn.neighbors import KNeighborsRegressor
from sklearn.utils.validation import check_random_state

# Load the faces datasets
data, targets = fetch_olivetti_faces(return_X_y=True)

train = data[targets < 30]
test = data[targets >= 30]  # Test on independent people

# Test on a subset of people
n_faces = 5
rng = check_random_state(4)
face_ids = rng.randint(test.shape[0], size=(n_faces,))
test = test[face_ids, :]

n_pixels = data.shape[1]
# Upper half of the faces
X_train = train[:, : (n_pixels + 1) // 2]
# Lower half of the faces
y_train = train[:, n_pixels // 2 :]
X_test = test[:, : (n_pixels + 1) // 2]
y_test = test[:, n_pixels // 2 :]

# Fit estimators
ESTIMATORS = {
    "Extra trees": ExtraTreesRegressor(
        n_estimators=10, max_features=32, random_state=0
    ),
    "K-nn": KNeighborsRegressor(),
    "Linear regression": LinearRegression(),
    "Ridge": RidgeCV(),
}

y_test_predict = dict()
for name, estimator in ESTIMATORS.items():
    estimator.fit(X_train, y_train)
    y_test_predict[name] = estimator.predict(X_test)

# Plot the completed faces
image_shape = (64, 64)

n_cols = 1 + len(ESTIMATORS)
plt.figure(figsize=(2.0 * n_cols, 2.26 * n_faces))
plt.suptitle("Face completion with multi-output estimators", size=16)

for i in range(n_faces):
    true_face = np.hstack((X_test[i], y_test[i]))

    if i:
        sub = plt.subplot(n_faces, n_cols, i * n_cols + 1)
    else:
        sub = plt.subplot(n_faces, n_cols, i * n_cols + 1, title="true faces")

    sub.axis("off")
    sub.imshow(
        true_face.reshape(image_shape), cmap=plt.cm.gray, interpolation="nearest"
    )

    for j, est in enumerate(sorted(ESTIMATORS)):
        completed_face = np.hstack((X_test[i], y_test_predict[est][i]))

        if i:
            sub = plt.subplot(n_faces, n_cols, i * n_cols + 2 + j)

        else:
            sub = plt.subplot(n_faces, n_cols, i * n_cols + 2 + j, title=est)

        sub.axis("off")
        sub.imshow(
            completed_face.reshape(image_shape),
            cmap=plt.cm.gray,
            interpolation="nearest",
        )

plt.show()
腳本總執行時間:(0 分鐘 1.968 秒)
相關範例