注意
前往結尾以下載完整的範例程式碼。或透過 JupyterLite 或 Binder 在您的瀏覽器中執行此範例
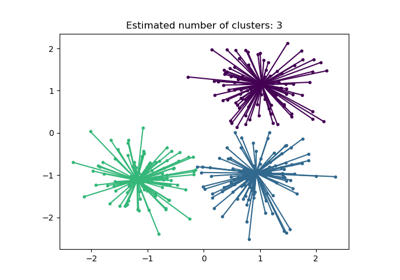
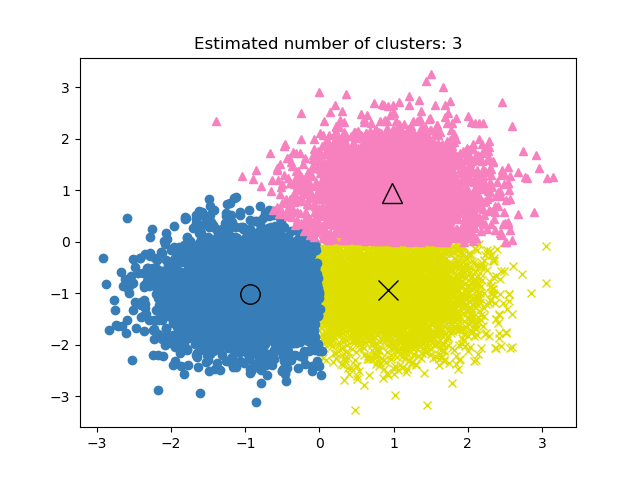
均值漂移群集演算法的演示#
參考資料
Dorin Comaniciu 和 Peter Meer,「Mean Shift: A robust approach toward feature space analysis」。IEEE Transactions on Pattern Analysis and Machine Intelligence。2002。第 603-619 頁。
# Authors: The scikit-learn developers
# SPDX-License-Identifier: BSD-3-Clause

import numpy as np

from sklearn.cluster import MeanShift, estimate_bandwidth
from sklearn.datasets import make_blobs
產生範例資料#
centers = [[1, 1], [-1, -1], [1, -1]]
X, _ = make_blobs(n_samples=10000, centers=centers, cluster_std=0.6)
使用 MeanShift 計算群集#
# The following bandwidth can be automatically detected using
bandwidth = estimate_bandwidth(X, quantile=0.2, n_samples=500)

ms = MeanShift(bandwidth=bandwidth, bin_seeding=True)
ms.fit(X)
labels = ms.labels_
cluster_centers = ms.cluster_centers_

labels_unique = np.unique(labels)
n_clusters_ = len(labels_unique)

print("number of estimated clusters : %d" % n_clusters_)
number of estimated clusters : 3
繪製結果#
import matplotlib.pyplot as plt

plt.figure(1)
plt.clf()

colors = ["#dede00", "#377eb8", "#f781bf"]
markers = ["x", "o", "^"]

for k, col in zip(range(n_clusters_), colors):
    my_members = labels == k
    cluster_center = cluster_centers[k]
    plt.plot(X[my_members, 0], X[my_members, 1], markers[k], color=col)
    plt.plot(
        cluster_center[0],
        cluster_center[1],
        markers[k],
        markerfacecolor=col,
        markeredgecolor="k",
        markersize=14,
    )
plt.title("Estimated number of clusters: %d" % n_clusters_)
plt.show()
腳本總執行時間: (0 分鐘 0.441 秒)
相關範例