注意
前往結尾以下載完整的範例程式碼。或者透過 JupyterLite 或 Binder 在您的瀏覽器中執行此範例
檢測錯誤權衡 (DET) 曲線#
在此範例中,我們比較了兩個二元分類多閾值指標:接收者操作特徵 (ROC) 和檢測錯誤權衡 (DET)。為此,我們針對相同的分類任務評估了兩個不同的分類器。
ROC 曲線在 Y 軸上具有真正陽性率 (TPR),在 X 軸上具有假陽性率 (FPR)。這表示圖表的左上角是「理想」點 - FPR 為零,TPR 為一。
DET 曲線是 ROC 曲線的變體,其中假陰性率 (FNR) 繪製在 y 軸上,而不是 TPR。在這種情況下,原點(左下角)是「理想」點。
注意
請參閱
sklearn.metrics.roc_curve以取得有關 ROC 曲線的更多資訊。請參閱
sklearn.metrics.det_curve以取得有關 DET 曲線的更多資訊。此範例大致基於 分類器比較 範例。
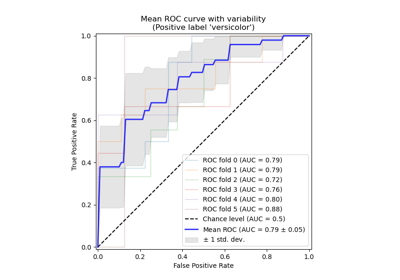
請參閱 具有交叉驗證的接收者操作特徵 (ROC) 以取得評估 ROC 曲線和 ROC-AUC 變異數的範例。
# Authors: The scikit-learn developers
# SPDX-License-Identifier: BSD-3-Clause
產生合成資料#
from sklearn.datasets import make_classification
from sklearn.model_selection import train_test_split
from sklearn.preprocessing import StandardScaler

X, y = make_classification(
    n_samples=1_000,
    n_features=2,
    n_redundant=0,
    n_informative=2,
    random_state=1,
    n_clusters_per_class=1,
)

X_train, X_test, y_train, y_test = train_test_split(X, y, test_size=0.4, random_state=0)
定義分類器#
在這裡,我們定義兩個不同的分類器。目的是使用 ROC 和 DET 曲線,在視覺上比較它們跨閾值的統計效能。選擇這些分類器沒有特別的原因,scikit-learn 中還有其他可用的分類器。
from sklearn.ensemble import RandomForestClassifier
from sklearn.pipeline import make_pipeline
from sklearn.svm import LinearSVC

classifiers = {
    "Linear SVM": make_pipeline(StandardScaler(), LinearSVC(C=0.025)),
    "Random Forest": RandomForestClassifier(
        max_depth=5, n_estimators=10, max_features=1
    ),
}
繪製 ROC 和 DET 曲線#
DET 曲線通常以常態偏差尺度繪製。為了實現這一點,DET 顯示會轉換 det_curve 傳回的錯誤率,並使用 scipy.stats.norm 轉換軸尺度。
import matplotlib.pyplot as plt

from sklearn.metrics import DetCurveDisplay, RocCurveDisplay

fig, [ax_roc, ax_det] = plt.subplots(1, 2, figsize=(11, 5))

for name, clf in classifiers.items():
    clf.fit(X_train, y_train)

    RocCurveDisplay.from_estimator(clf, X_test, y_test, ax=ax_roc, name=name)
    DetCurveDisplay.from_estimator(clf, X_test, y_test, ax=ax_det, name=name)

ax_roc.set_title("Receiver Operating Characteristic (ROC) curves")
ax_det.set_title("Detection Error Tradeoff (DET) curves")

ax_roc.grid(linestyle="--")
ax_det.grid(linestyle="--")

plt.legend()
plt.show()
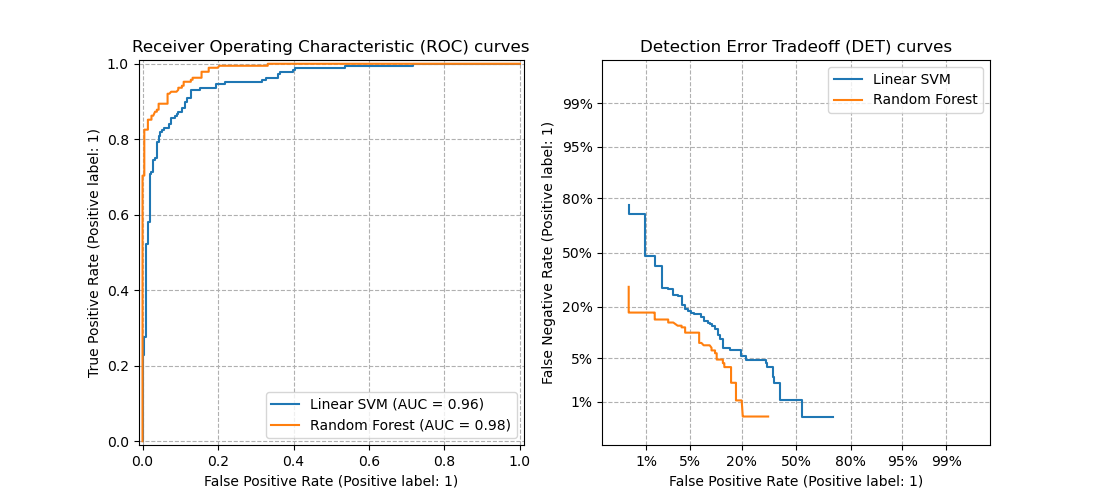
請注意,使用 DET 曲線比使用 ROC 曲線更容易視覺評估不同分類演算法的整體效能。由於 ROC 曲線以線性尺度繪製,因此不同的分類器通常在圖表的很大一部分看起來相似,並且在圖表的左上角差異最大。另一方面,由於 DET 曲線以常態偏差尺度表示直線,因此它們往往可以整體區分,並且感興趣的區域跨越圖表的很大一部分。
DET 曲線直接提供檢測錯誤權衡的回饋,以協助進行操作點分析。然後,使用者可以決定他們願意接受的 FNR,以換取 FPR(或反之亦然)。
腳本的總執行時間:(0 分鐘 0.196 秒)
相關範例