注意
跳到結尾 以下載完整的範例程式碼。 或透過 JupyterLite 或 Binder 在您的瀏覽器中執行此範例
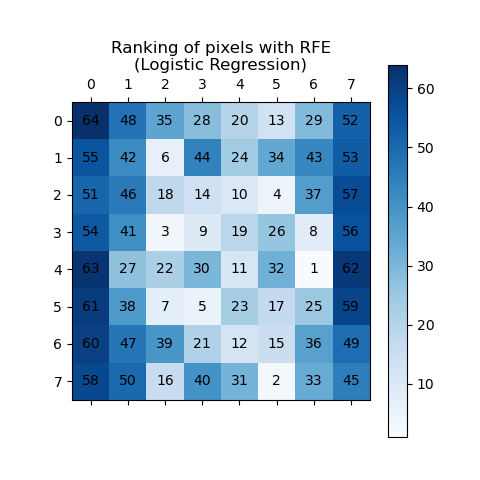
遞迴特徵消除#
此範例示範如何使用遞迴特徵消除 (RFE) 來判斷個別像素對於分類手寫數字的重要性。RFE 會遞迴移除最不重要的特徵,根據其重要性分配等級,其中較高的 ranking_ 值表示較低的重要性。為了清楚起見,排名會同時使用藍色陰影和像素註釋來視覺化。如預期的,位於影像中心的像素往往比靠近邊緣的像素更具預測性。
注意
另請參閱 使用交叉驗證的遞迴特徵消除
# Authors: The scikit-learn developers
# SPDX-License-Identifier: BSD-3-Clause

import matplotlib.pyplot as plt

from sklearn.datasets import load_digits
from sklearn.feature_selection import RFE
from sklearn.linear_model import LogisticRegression
from sklearn.pipeline import Pipeline
from sklearn.preprocessing import MinMaxScaler

# Load the digits dataset
digits = load_digits()
X = digits.images.reshape((len(digits.images), -1))
y = digits.target

pipe = Pipeline(
    [
        ("scaler", MinMaxScaler()),
        ("rfe", RFE(estimator=LogisticRegression(), n_features_to_select=1, step=1)),
    ]
)

pipe.fit(X, y)
ranking = pipe.named_steps["rfe"].ranking_.reshape(digits.images[0].shape)

# Plot pixel ranking
plt.matshow(ranking, cmap=plt.cm.Blues)

# Add annotations for pixel numbers
for i in range(ranking.shape[0]):
    for j in range(ranking.shape[1]):
        plt.text(j, i, str(ranking[i, j]), ha="center", va="center", color="black")

plt.colorbar()
plt.title("Ranking of pixels with RFE\n(Logistic Regression)")
plt.show()
腳本的總執行時間: (0 分鐘 3.104 秒)
相關範例