注意
跳到結尾以下載完整的範例程式碼。或透過 JupyterLite 或 Binder 在您的瀏覽器中執行此範例
影像分割的光譜聚類#
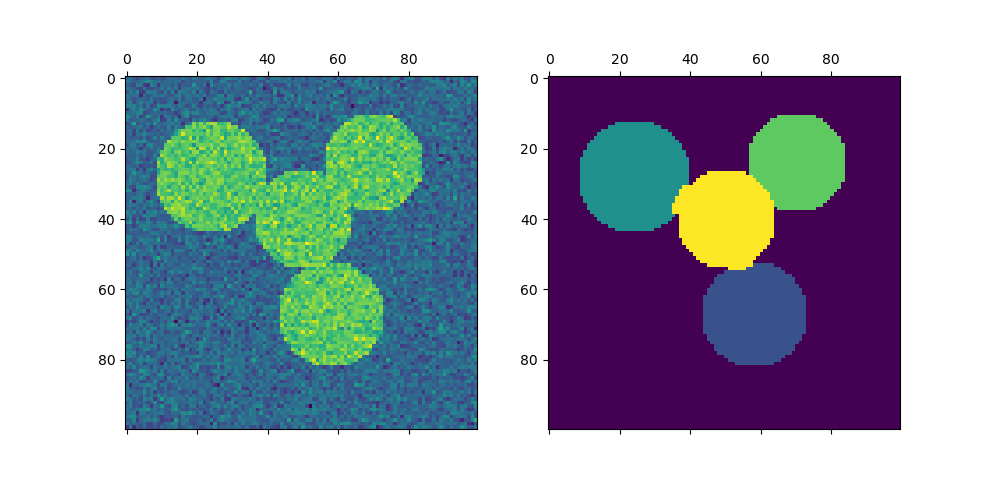
在此範例中,會產生一個具有相連圓形的影像,並使用光譜聚類來分隔圓形。
在這些設定中,光譜聚類方法解決了稱為「正規化圖割」的問題:影像被視為相連體素的圖形,而光譜聚類演算法相當於選擇定義區域的圖割,同時最小化沿割線的梯度比率和區域的體積。
由於演算法嘗試平衡體積(即平衡區域大小),如果我們採用不同大小的圓形,則分割將會失敗。
此外,由於影像的強度或其梯度中沒有有用的資訊,我們選擇在僅由梯度弱知情的圖形上執行光譜聚類。這接近於執行圖形的 Voronoi 分割。
此外,我們使用物件的遮罩將圖形限制為物件的輪廓。在此範例中,我們有興趣將物件彼此分開,而不是與背景分開。
# Authors: The scikit-learn developers
# SPDX-License-Identifier: BSD-3-Clause
產生資料#
import numpy as np

l = 100
x, y = np.indices((l, l))

center1 = (28, 24)
center2 = (40, 50)
center3 = (67, 58)
center4 = (24, 70)

radius1, radius2, radius3, radius4 = 16, 14, 15, 14

circle1 = (x - center1[0]) ** 2 + (y - center1[1]) ** 2 < radius1**2
circle2 = (x - center2[0]) ** 2 + (y - center2[1]) ** 2 < radius2**2
circle3 = (x - center3[0]) ** 2 + (y - center3[1]) ** 2 < radius3**2
circle4 = (x - center4[0]) ** 2 + (y - center4[1]) ** 2 < radius4**2
繪製四個圓形#
img = circle1 + circle2 + circle3 + circle4

# We use a mask that limits to the foreground: the problem that we are
# interested in here is not separating the objects from the background,
# but separating them one from the other.
mask = img.astype(bool)

img = img.astype(float)
img += 1 + 0.2 * np.random.randn(*img.shape)
將影像轉換為具有邊緣梯度值的圖形。
from sklearn.feature_extraction import image

graph = image.img_to_graph(img, mask=mask)
取梯度的一個遞減函數,產生接近 Voronoi 分割的分割
graph.data = np.exp(-graph.data / graph.data.std())
這裡我們使用 arpack 求解器執行光譜聚類,因為 amg 在此範例中數值不穩定。然後我們繪製結果。
import matplotlib.pyplot as plt

from sklearn.cluster import spectral_clustering

labels = spectral_clustering(graph, n_clusters=4, eigen_solver="arpack")
label_im = np.full(mask.shape, -1.0)
label_im[mask] = labels

fig, axs = plt.subplots(nrows=1, ncols=2, figsize=(10, 5))
axs[0].matshow(img)
axs[1].matshow(label_im)

plt.show()
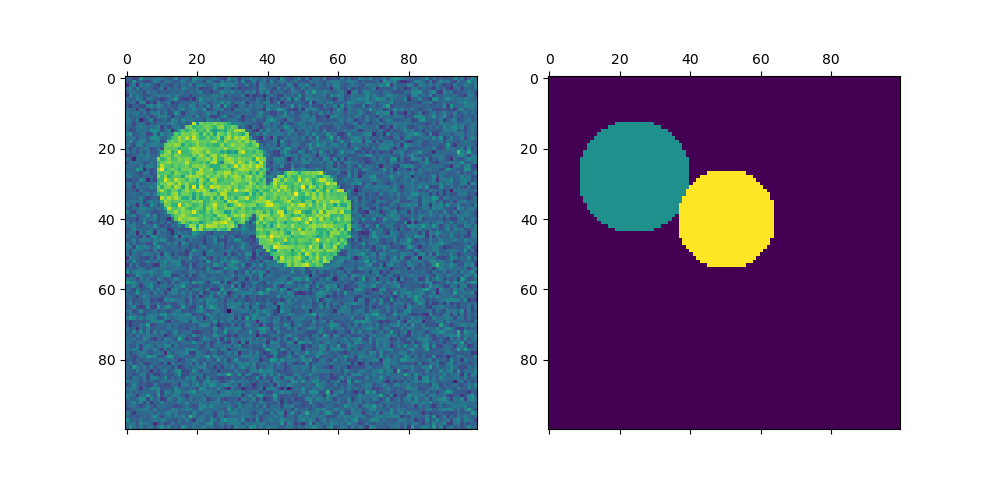
繪製兩個圓形#
這裡我們重複上述過程,但僅考慮我們產生的前兩個圓形。請注意,這會導致圓形之間更乾淨的分隔,因為在這種情況下更容易平衡區域大小。
img = circle1 + circle2
mask = img.astype(bool)
img = img.astype(float)

img += 1 + 0.2 * np.random.randn(*img.shape)

graph = image.img_to_graph(img, mask=mask)
graph.data = np.exp(-graph.data / graph.data.std())

labels = spectral_clustering(graph, n_clusters=2, eigen_solver="arpack")
label_im = np.full(mask.shape, -1.0)
label_im[mask] = labels

fig, axs = plt.subplots(nrows=1, ncols=2, figsize=(10, 5))
axs[0].matshow(img)
axs[1].matshow(label_im)

plt.show()
腳本的總執行時間:(0 分鐘 0.510 秒)
相關範例