注意
前往結尾下載完整的範例程式碼。或透過 JupyterLite 或 Binder 在您的瀏覽器中執行此範例
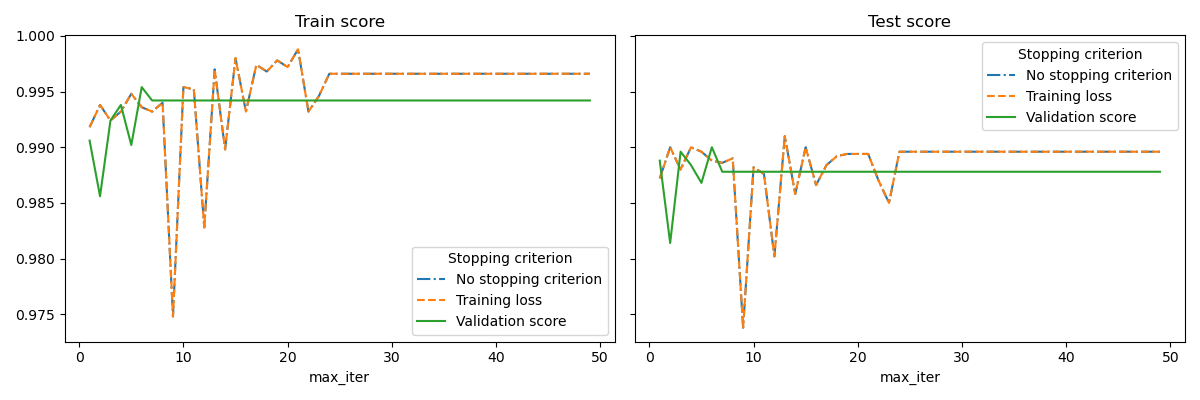
隨機梯度下降的提前停止#
隨機梯度下降是一種最佳化技術,它以隨機方式最小化損失函數,逐個樣本執行梯度下降步驟。特別是,它是一種非常有效的方法來擬合線性模型。
作為一種隨機方法,損失函數不一定在每次迭代時都下降,並且僅在期望中保證收斂。因此,監控損失函數的收斂可能很困難。
另一種方法是監控驗證分數的收斂。在這種情況下,輸入資料會分成訓練集和驗證集。然後在訓練集上擬合模型,並且停止準則基於驗證集上計算的預測分數。這使我們能夠找到足夠構建一個可以很好地泛化到未見資料並減少過度擬合訓練資料的機會的模型所需的最小迭代次數。
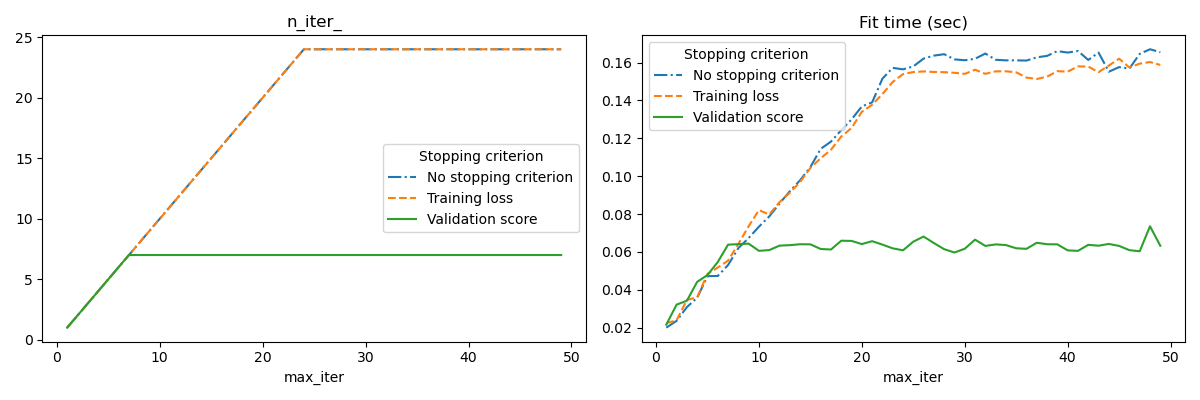
如果 early_stopping=True,則會啟用此提前停止策略;否則停止準則僅使用整個輸入資料上的訓練損失。為了更好地控制提前停止策略,我們可以指定一個參數 validation_fraction,它設定我們要保留以計算驗證分數的輸入資料集比例。最佳化將會持續,直到驗證分數在最後 n_iter_no_change 次迭代中至少沒有改善 tol 為止。實際迭代次數可在屬性 n_iter_ 中取得。
此範例說明如何將提前停止用於 SGDClassifier 模型中,以達到與沒有提前停止的模型幾乎相同的準確度。這可以顯著縮短訓練時間。請注意,即使從早期迭代開始,停止準則之間的分數也會有所不同,因為某些訓練資料會使用驗證停止準則保留。
No stopping criterion: .................................................
Training loss: .................................................
Validation score: .................................................
# Authors: The scikit-learn developers
# SPDX-License-Identifier: BSD-3-Clause

import sys
import time

import matplotlib.pyplot as plt
import numpy as np
import pandas as pd

from sklearn import linear_model
from sklearn.datasets import fetch_openml
from sklearn.exceptions import ConvergenceWarning
from sklearn.model_selection import train_test_split
from sklearn.utils import shuffle
from sklearn.utils._testing import ignore_warnings


def load_mnist(n_samples=None, class_0="0", class_1="8"):
    """Load MNIST, select two classes, shuffle and return only n_samples."""
    # Load data from http://openml.org/d/554
    mnist = fetch_openml("mnist_784", version=1, as_frame=False)

    # take only two classes for binary classification
    mask = np.logical_or(mnist.target == class_0, mnist.target == class_1)

    X, y = shuffle(mnist.data[mask], mnist.target[mask], random_state=42)
    if n_samples is not None:
        X, y = X[:n_samples], y[:n_samples]
    return X, y


@ignore_warnings(category=ConvergenceWarning)
def fit_and_score(estimator, max_iter, X_train, X_test, y_train, y_test):
    """Fit the estimator on the train set and score it on both sets"""
    estimator.set_params(max_iter=max_iter)
    estimator.set_params(random_state=0)

    start = time.time()
    estimator.fit(X_train, y_train)

    fit_time = time.time() - start
    n_iter = estimator.n_iter_
    train_score = estimator.score(X_train, y_train)
    test_score = estimator.score(X_test, y_test)

    return fit_time, n_iter, train_score, test_score


# Define the estimators to compare
estimator_dict = {
    "No stopping criterion": linear_model.SGDClassifier(n_iter_no_change=3),
    "Training loss": linear_model.SGDClassifier(
        early_stopping=False, n_iter_no_change=3, tol=0.1
    ),
    "Validation score": linear_model.SGDClassifier(
        early_stopping=True, n_iter_no_change=3, tol=0.0001, validation_fraction=0.2
    ),
}

# Load the dataset
X, y = load_mnist(n_samples=10000)
X_train, X_test, y_train, y_test = train_test_split(X, y, test_size=0.5, random_state=0)

results = []
for estimator_name, estimator in estimator_dict.items():
    print(estimator_name + ": ", end="")
    for max_iter in range(1, 50):
        print(".", end="")
        sys.stdout.flush()

        fit_time, n_iter, train_score, test_score = fit_and_score(
            estimator, max_iter, X_train, X_test, y_train, y_test
        )

        results.append(
            (estimator_name, max_iter, fit_time, n_iter, train_score, test_score)
        )
    print("")

# Transform the results in a pandas dataframe for easy plotting
columns = [
    "Stopping criterion",
    "max_iter",
    "Fit time (sec)",
    "n_iter_",
    "Train score",
    "Test score",
]
results_df = pd.DataFrame(results, columns=columns)

# Define what to plot
lines = "Stopping criterion"
x_axis = "max_iter"
styles = ["-.", "--", "-"]

# First plot: train and test scores
fig, axes = plt.subplots(nrows=1, ncols=2, sharey=True, figsize=(12, 4))
for ax, y_axis in zip(axes, ["Train score", "Test score"]):
    for style, (criterion, group_df) in zip(styles, results_df.groupby(lines)):
        group_df.plot(x=x_axis, y=y_axis, label=criterion, ax=ax, style=style)
    ax.set_title(y_axis)
    ax.legend(title=lines)
fig.tight_layout()

# Second plot: n_iter and fit time
fig, axes = plt.subplots(nrows=1, ncols=2, figsize=(12, 4))
for ax, y_axis in zip(axes, ["n_iter_", "Fit time (sec)"]):
    for style, (criterion, group_df) in zip(styles, results_df.groupby(lines)):
        group_df.plot(x=x_axis, y=y_axis, label=criterion, ax=ax, style=style)
    ax.set_title(y_axis)
    ax.legend(title=lines)
fig.tight_layout()

plt.show()
腳本的總執行時間: (0 分鐘 23.900 秒)
相關範例