注意
前往結尾 以下載完整的範例程式碼。或透過 JupyterLite 或 Binder 在您的瀏覽器中執行此範例
使用排列測試分類分數的顯著性#
此範例示範如何使用 permutation_test_score 來評估使用排列的交叉驗證分數的顯著性。
# Authors: The scikit-learn developers
# SPDX-License-Identifier: BSD-3-Clause
資料集#
我們將使用 鳶尾花植物資料集,其中包含從 3 種鳶尾花取得的測量值。
我們也會產生一些隨機特徵資料(即 20 個特徵),與鳶尾花資料集中的類別標籤無關。
import numpy as np

n_uncorrelated_features = 20
rng = np.random.RandomState(seed=0)
# Use same number of samples as in iris and 20 features
X_rand = rng.normal(size=(X.shape[0], n_uncorrelated_features))
排列測試分數#
接下來,我們使用原始鳶尾花資料集計算 permutation_test_score,該資料集強烈預測標籤,以及隨機產生的特徵和鳶尾花標籤,這些特徵和標籤之間應該沒有依賴關係。我們使用 SVC 分類器和 準確度分數 來評估每一輪的模型。
permutation_test_score 透過計算分類器在資料集的 1000 種不同排列上的準確度來產生零分佈,其中特徵保持不變,但標籤經歷不同的排列。這是虛無假設的分佈,該假設表示特徵和標籤之間沒有依賴關係。然後計算經驗 p 值,即獲得的分數大於使用原始資料獲得的分數的排列百分比。
from sklearn.model_selection import StratifiedKFold, permutation_test_score
from sklearn.svm import SVC

clf = SVC(kernel="linear", random_state=7)
cv = StratifiedKFold(2, shuffle=True, random_state=0)

score_iris, perm_scores_iris, pvalue_iris = permutation_test_score(
    clf, X, y, scoring="accuracy", cv=cv, n_permutations=1000
)

score_rand, perm_scores_rand, pvalue_rand = permutation_test_score(
    clf, X_rand, y, scoring="accuracy", cv=cv, n_permutations=1000
)
原始資料#
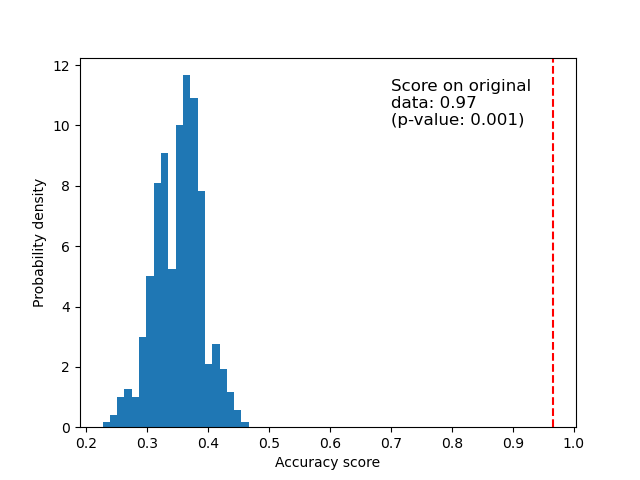
下面我們繪製排列分數的長條圖(零分佈)。紅線表示分類器在原始資料上獲得的分數。該分數比使用排列資料獲得的分數好得多,因此 p 值非常低。這表示僅靠偶然性獲得此良好分數的可能性很低。它提供了證據,證明鳶尾花資料集包含特徵和標籤之間的真實依賴關係,而分類器能夠利用這一點來獲得良好的結果。
import matplotlib.pyplot as plt

fig, ax = plt.subplots()

ax.hist(perm_scores_iris, bins=20, density=True)
ax.axvline(score_iris, ls="--", color="r")
score_label = f"Score on original\ndata: {score_iris:.2f}\n(p-value: {pvalue_iris:.3f})"
ax.text(0.7, 10, score_label, fontsize=12)
ax.set_xlabel("Accuracy score")
_ = ax.set_ylabel("Probability density")
隨機資料#
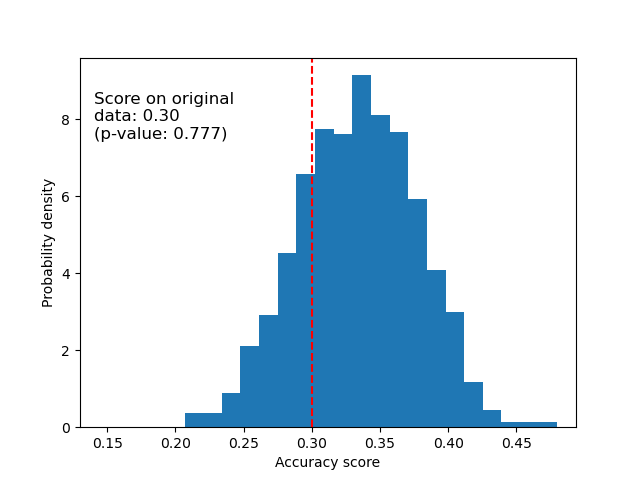
下面我們繪製隨機資料的零分佈。排列分數與使用原始鳶尾花資料集獲得的分數相似,因為排列總是會破壞存在的任何特徵標籤依賴關係。不過,在這種情況下,在原始隨機資料上獲得的分數非常差。這會導致較大的 p 值,確認原始資料中沒有特徵標籤依賴關係。
fig, ax = plt.subplots()

ax.hist(perm_scores_rand, bins=20, density=True)
ax.set_xlim(0.13)
ax.axvline(score_rand, ls="--", color="r")
score_label = f"Score on original\ndata: {score_rand:.2f}\n(p-value: {pvalue_rand:.3f})"
ax.text(0.14, 7.5, score_label, fontsize=12)
ax.set_xlabel("Accuracy score")
ax.set_ylabel("Probability density")
plt.show()
獲得高 p 值的另一個可能原因是分類器無法使用資料中的結構。在這種情況下,p 值僅對於能夠利用存在的依賴關係的分類器來說才會較低。在上面的案例中,資料是隨機的,由於資料中不存在結構,所有分類器的 p 值都會很高。
最後,請注意,即使資料中只有微弱的結構,此測試也已顯示會產生低 p 值 [1]。
參考文獻
指令碼的總執行時間:(0 分鐘 13.452 秒)
相關範例