註記
前往結尾下載完整的範例程式碼。或透過 JupyterLite 或 Binder 在您的瀏覽器中執行此範例
巢狀與非巢狀交叉驗證#
此範例比較在 iris 數據集分類器上的非巢狀和巢狀交叉驗證策略。巢狀交叉驗證 (CV) 通常用於訓練也需要優化超參數的模型。巢狀 CV 估計基礎模型及其(超)參數搜尋的泛化誤差。選擇最大化非巢狀 CV 的參數會使模型偏向數據集,產生過於樂觀的分數。
不使用巢狀 CV 的模型選擇使用相同的數據來調整模型參數並評估模型效能。因此,資訊可能會「洩漏」到模型中並過度擬合數據。這種影響的大小主要取決於數據集的大小和模型的穩定性。有關這些問題的分析,請參閱 Cawley 和 Talbot [1]。
為了避免這個問題,巢狀 CV 有效地使用了一系列的訓練/驗證/測試集分割。在內部循環(此處由 GridSearchCV 執行)中,透過將模型擬合到每個訓練集來近似最大化分數,然後在驗證集上選擇(超)參數時直接最大化。在外部循環(此處在 cross_val_score 中)中,透過平均幾個數據集分割上的測試集分數來估計泛化誤差。
下面的範例使用具有非線性核的支持向量分類器,透過網格搜尋建立具有最佳化超參數的模型。我們透過取它們分數之間的差異來比較非巢狀和巢狀 CV 策略的效能。
另請參閱
參考文獻
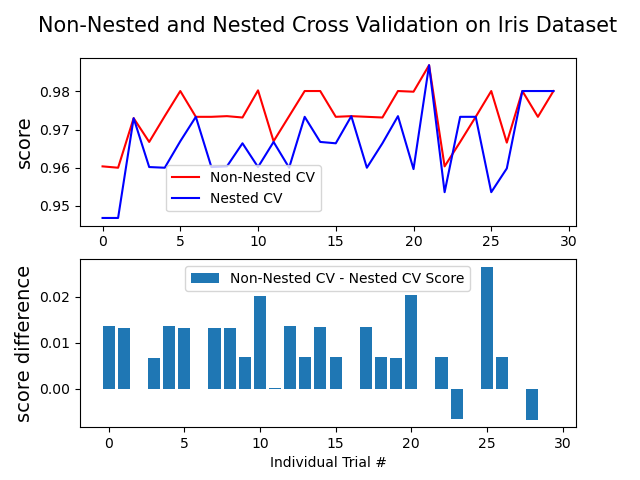
Average difference of 0.007581 with std. dev. of 0.007833.
# Authors: The scikit-learn developers
# SPDX-License-Identifier: BSD-3-Clause

import numpy as np
from matplotlib import pyplot as plt

from sklearn.datasets import load_iris
from sklearn.model_selection import GridSearchCV, KFold, cross_val_score
from sklearn.svm import SVC

# Number of random trials
NUM_TRIALS = 30

# Load the dataset
iris = load_iris()
X_iris = iris.data
y_iris = iris.target

# Set up possible values of parameters to optimize over
p_grid = {"C": [1, 10, 100], "gamma": [0.01, 0.1]}

# We will use a Support Vector Classifier with "rbf" kernel
svm = SVC(kernel="rbf")

# Arrays to store scores
non_nested_scores = np.zeros(NUM_TRIALS)
nested_scores = np.zeros(NUM_TRIALS)

# Loop for each trial
for i in range(NUM_TRIALS):
    # Choose cross-validation techniques for the inner and outer loops,
    # independently of the dataset.
    # E.g "GroupKFold", "LeaveOneOut", "LeaveOneGroupOut", etc.
    inner_cv = KFold(n_splits=4, shuffle=True, random_state=i)
    outer_cv = KFold(n_splits=4, shuffle=True, random_state=i)

    # Non_nested parameter search and scoring
    clf = GridSearchCV(estimator=svm, param_grid=p_grid, cv=outer_cv)
    clf.fit(X_iris, y_iris)
    non_nested_scores[i] = clf.best_score_

    # Nested CV with parameter optimization
    clf = GridSearchCV(estimator=svm, param_grid=p_grid, cv=inner_cv)
    nested_score = cross_val_score(clf, X=X_iris, y=y_iris, cv=outer_cv)
    nested_scores[i] = nested_score.mean()

score_difference = non_nested_scores - nested_scores

print(
    "Average difference of {:6f} with std. dev. of {:6f}.".format(
        score_difference.mean(), score_difference.std()
    )
)

# Plot scores on each trial for nested and non-nested CV
plt.figure()
plt.subplot(211)
(non_nested_scores_line,) = plt.plot(non_nested_scores, color="r")
(nested_line,) = plt.plot(nested_scores, color="b")
plt.ylabel("score", fontsize="14")
plt.legend(
    [non_nested_scores_line, nested_line],
    ["Non-Nested CV", "Nested CV"],
    bbox_to_anchor=(0, 0.4, 0.5, 0),
)
plt.title(
    "Non-Nested and Nested Cross Validation on Iris Dataset",
    x=0.5,
    y=1.1,
    fontsize="15",
)

# Plot bar chart of the difference.
plt.subplot(212)
difference_plot = plt.bar(range(NUM_TRIALS), score_difference)
plt.xlabel("Individual Trial #")
plt.legend(
    [difference_plot],
    ["Non-Nested CV - Nested CV Score"],
    bbox_to_anchor=(0, 1, 0.8, 0),
)
plt.ylabel("score difference", fontsize="14")

plt.show()
腳本的總運行時間: (0 分鐘 7.079 秒)
相關範例