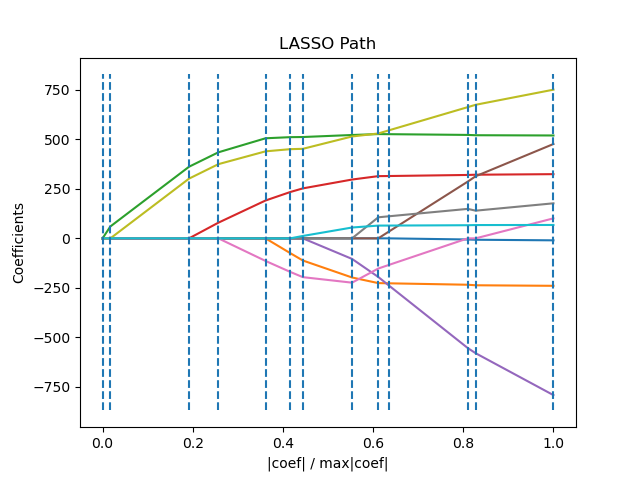
使用 LARS 的 Lasso 路徑#
使用 LARS 演算法計算糖尿病數據集上沿正則化參數的 Lasso 路徑。每種顏色代表係數向量的一種不同特徵,並將其顯示為正則化參數的函數。
Computing regularization path using the LARS ...
.
# Author: Fabian Pedregosa <fabian.pedregosa@inria.fr>
#         Alexandre Gramfort <alexandre.gramfort@inria.fr>
# License: BSD 3 clause

import matplotlib.pyplot as plt
import numpy as np

from sklearn import datasets, linear_model

X, y = datasets.load_diabetes(return_X_y=True)

print("Computing regularization path using the LARS ...")
_, _, coefs = linear_model.lars_path(X, y, method="lasso", verbose=True)

xx = np.sum(np.abs(coefs.T), axis=1)
xx /= xx[-1]

plt.plot(xx, coefs.T)
ymin, ymax = plt.ylim()
plt.vlines(xx, ymin, ymax, linestyle="dashed")
plt.xlabel("|coef| / max|coef|")
plt.ylabel("Coefficients")
plt.title("LASSO Path")
plt.axis("tight")
plt.show()
腳本總運行時間:(0 分鐘 0.098 秒)
相關範例
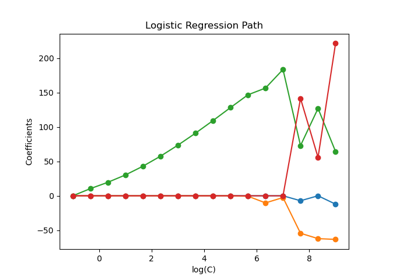
L1 邏輯迴歸的正則化路徑(Regularization path of L1- Logistic Regression)
L1 邏輯迴歸的正則化路徑(Regularization path of L1- Logistic Regression)
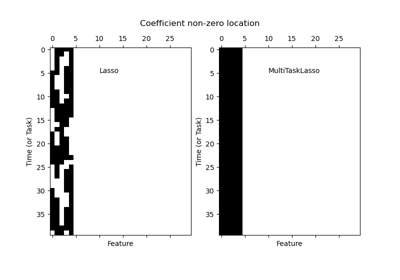
使用多任務 Lasso 進行聯合特徵選擇(Joint feature selection with multi-task Lasso)
使用多任務 Lasso 進行聯合特徵選擇(Joint feature selection with multi-task Lasso)
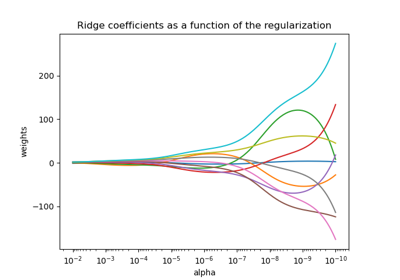
繪製嶺係數作為正則化函數(Plot Ridge coefficients as a function of the regularization)
繪製嶺係數作為正則化函數(Plot Ridge coefficients as a function of the regularization)